 I’m occasionally challenged on the claim that Little Bay was once one of the biggest spots on the island. This isn’t surprising considering the contrast between a current population of 100 and the 19th century hub I describe. I’ve decided to list my sources for the total population numbers.
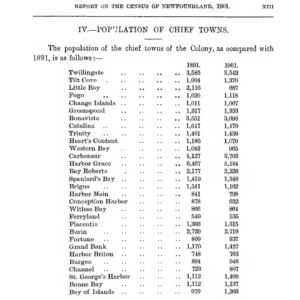
I’ve made a list of all the references to the population of Little Bay I’ve collected so far which you’ll find below. I’ve included the number of men employed at the mine with the total population numbers where available. You can see how quickly the population rises from zero in 1878 to a peak population recorded in 1891 of 2116 people. This placed it eighth of Newfoundland’s most populated communities that year. However, the claim that the total number of men employed at the mine was 1500 in 1886 indicates that the total population may have been significantly higher, however briefly. I suspect an accurate top figure to be closer to 3000 but I lack data to confirm such. Little Bay’s population changed often.
You can see the transient nature of the town’s population by charting out the numbers as I have done below. Drops in copper prices that resulted in unemployment caused many miners to return to their original homes. Further, many miners would switch into fishing during such periods which is why you see different job listings for the same men in different years. Other events impacted the population. For example, in 1880 the original German population departed making things uncertain for everyone there due to the change in mine ownership. In 1881 a mass layoff resulted in a strike and early 1885 was particularly lean. From 1889 onward you see a steady decrease in copper production and therefore population. The highest population I have recorded is from 1891. This was two years into a production decline that would result in an exodus of miners for Glace Bay, Nova Scotia.
You’ll notice the population drops from over 2000 to under 700 between 1891 and 1901. This was before the fire that finally devastated the area in 1904. The mine was already dying before that happened and this is why most of the place wasn’t rebuilt. After the fire we witness another mass exodus with most ending up at either Grand Falls or Bell Island.
Little Bay population totals taken after the 1901 census are problematic. As I explained in my piece on the districts of Little Bay, I’m fairly certain the whole area supporting the mine was counted together as Little Bay Mines until the 1904 fire happened. After that the various parts of Little Bay Mines identified as different communities so from the 1911 census onward the populations of places such as St. Patrick’s, which were once part of Little Bay Mines, are recorded as towns in their own right.
I hope you’ll appreciate the number of families I have to cover in light of the scale of this spot. It really is a chunk of Newfoundland history that’s been largely missing. Oh, and for any researchers out there – you’ll want to know that data from the 1884 census can be found in the Twillingate Sun in 1887 with its March 19th and October 3rd entries.
Thanks for reading!
Population of Little Bay:
- 1878, July: 0 (Howley)
- 1878, Sept: 500+ (Journal of the House of Assembly)
- 1878, Sept: 530 men employed at the mine (Harvey)
- 1878, Oct: 1000 or 1500 (The Witness)
- 1879: 1500 (Journal of the House of Assembly)
- 1879, May: 1500 (The Witness)
- 1879, Nov: 1200 men employed at the mine (Harbour Grace Standard)
- 1880, May: 900 (Harbour Grace Standard)
- 1880, Nov: 1340 (The Witness)
- 1881: 800 men employed at the mine (Kennedy)
- 1881, June: 2000 (Kingston Daily British Whig)
- 1882: Between 1400 and 1500 (Twillingate Sun)
- 1882, June: 2000 (The Witness)
- 1884: 1538 with 404 men employed at the mine (Twillingate Sun)
- 1885: 200 men employed at the mine (Harbour Grace Standard)
- 1885, Dec: 500 men found employment at the mine (Harbour Grace Standard)
- 1886, June: 1500 men employed at the mine (Daily Colonist)
- 1886, Nov: 600 men employed at the mine (Harbour Grace Standard)
- 1887: 1800+ with 300+ men employed at the mine (Engineering and Mining Journal)
- 1888, Sept: Between 1100 and 700 men employed at the mine (Harbour Grace Standard)
- 1888, Oct: 1000+ (Evening Telegram)
- 1890, July: 700 men employed at the mine (Daily Colonist)
- 1890, Oct: 1600 (St. John’s Evening Herald)
- 1891: 2116 (Census)
- 1891, Nov: 2000+ (Twillingate Sun)
- 1901: 687 (Census)
- 1911: 193 (Census)
- 1921: 134 (Census)
- 1935: 93 (Census)
- 1945: 68 (Census)
- 1951: 51 (Census)
- 1956: 59 (Census)
- 1961: 123 (Census)
- 1966: 319 (Census)
- 1971: 503 (Census)
- 2021: 100 (Stats Can)